The MetroBoston DataCommon has been our region's go-to data viewer and web mapper since 2007. At Data Day, MAPC and the Boston Foundation will officially launch the DataCommon 2.0, completely redesigned with all-new Community Profiles, an easier-than-ever map interface, and a powerful new data visualization tool known as WEAVE. Create by UMass Lowell and the National Open Indicators Consortium, WEAVE will help users at all levels to analyze large datasets and visualize the results to guide your work and influence public policy.
Public Health - Seattle & King County joined the Open Indicator Consortium in late 2010. We have begun development of an application to run on-demand analyses of population-based vital statistics and survey datasets. Initially, the system will seamlessly deliver results to Weave for data visualization. A prototype that will use our existing proprietary analysis systems will be completed in March. We expect the prototype to provide automated surveillance of a selection of measures for visualization in the program.
(Inactive) Community Foundation for Greater Atlanta (Atlanta)
September 21, 2011
To help inform residents and engage them in neighborhood issues, the Knight Foundation has given a grant to the Community Foundation for Greater Atlanta to connect residents to an extensive data hub and train them on how to add their personal stories, photos and videos of their communities. The hub, called Neighborhood Nexus, is a comprehensive information resource that empowers community leaders to enhance the quality of life in the Atlanta region.
This Knight News Challenge Entry is entitled "Giving Voice to Louisiana’s Recovery: Data stories of resiliency and demographic change" It proposes to create visualizations of Southeast Louisiana’s post-disaster(s) population losses with community explanations of what’s needed for fuller recovery and greater resilience.
This Knight News Challenge entry proposes to create "FactTalk" to blend words, graphics, and numbers in a platform enabling conversation and action planning around the data.
Mobile-friendly interactive “influence maps” will organize associated variables by visually depicting reinforcing and moderating “upstream” and “downstream” indicators. Weave will enable users to explore these relationships, geographic distribution, and trend over time. The product will also enable people to discuss and organize around the data using PCs or phones.
This Knight News Challenge entry would enable anyone to add narrative clarity to static data visualizations with a web-ready, no coding required, interactive annotation tool. It includes using NNIP partners as beta testers.
InfoWorks is a collaborative effort between the Rhode Island Department of Education and The Providence Plan. The InfoWorks site is designed as user-friendly, easily accessible resource for anyone interested in Rhode Island's schools. Available data includes achievement results, demographics, funding, and opinion data.
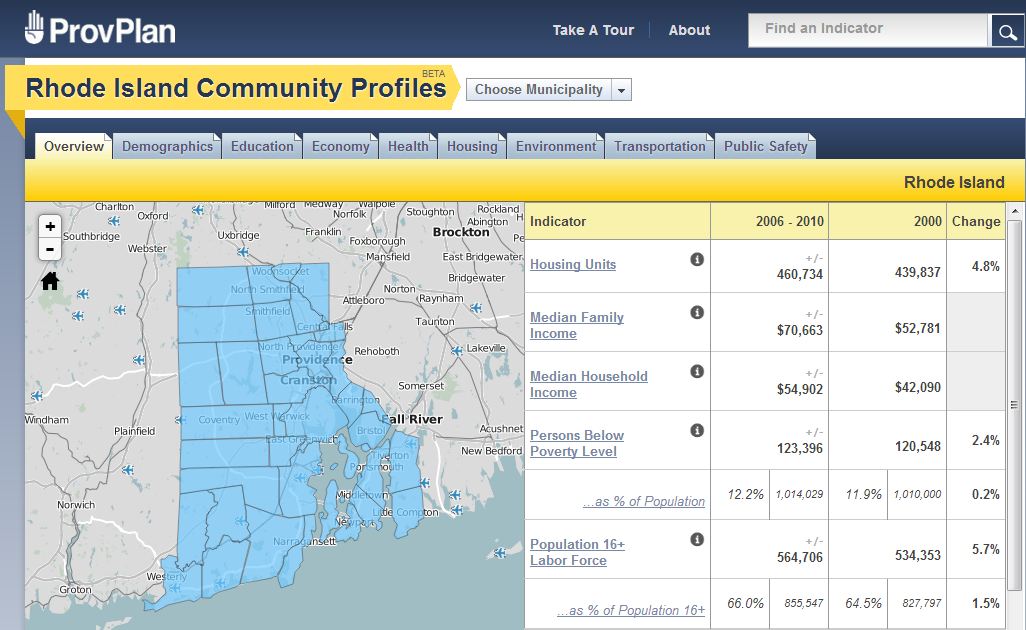
For almost a decade the Providence Neighborhood Profiles have been a critical resource for government, community organizations, and people simply interested in learning about the City. With generous funding from the Rhode Island Foundation and Rhode Island Statewide Planning Program, ProvPlan has developed a new site - Rhode Island Community Profiles - that provides a host of statewide information.
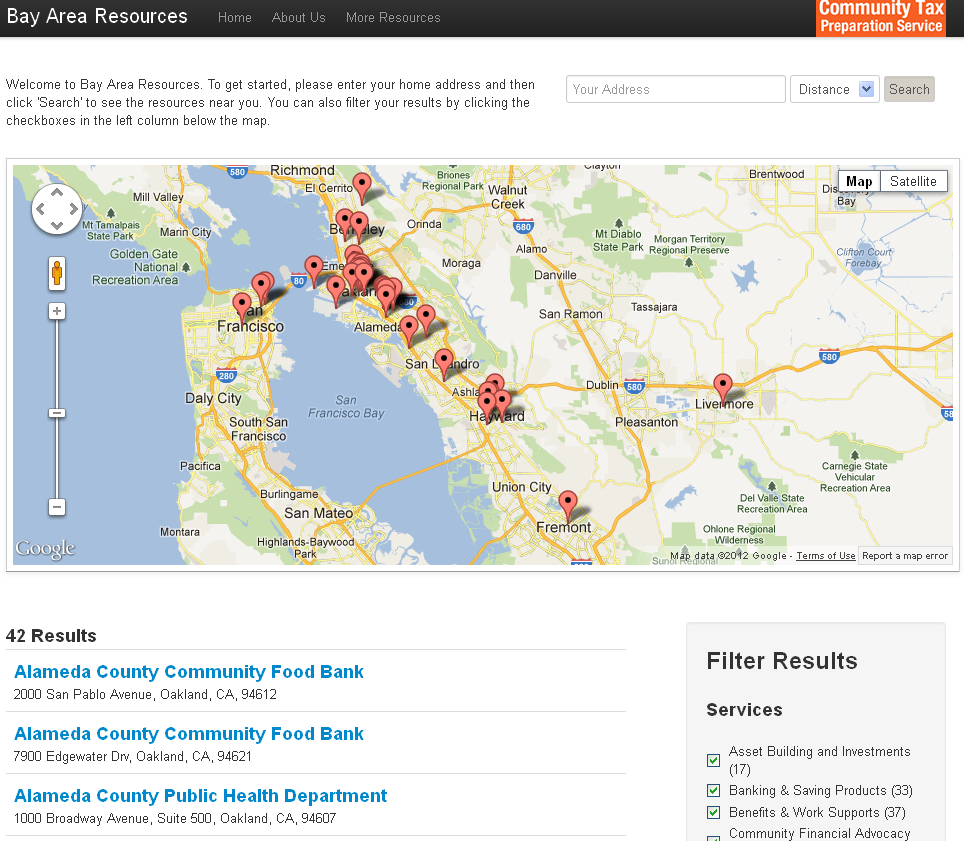
We are building an opensource local resource directory to replace our current asset service provider system. This is a Rails based app built on the Heroku platform and will be rapidly deployable in other cities with different focuses.
The app allows for basic service searching by custimizable categories, user management of local service provider data and location based filtering and searching. The default will allow for lanugage based service filtering also in a Yelp like interface.
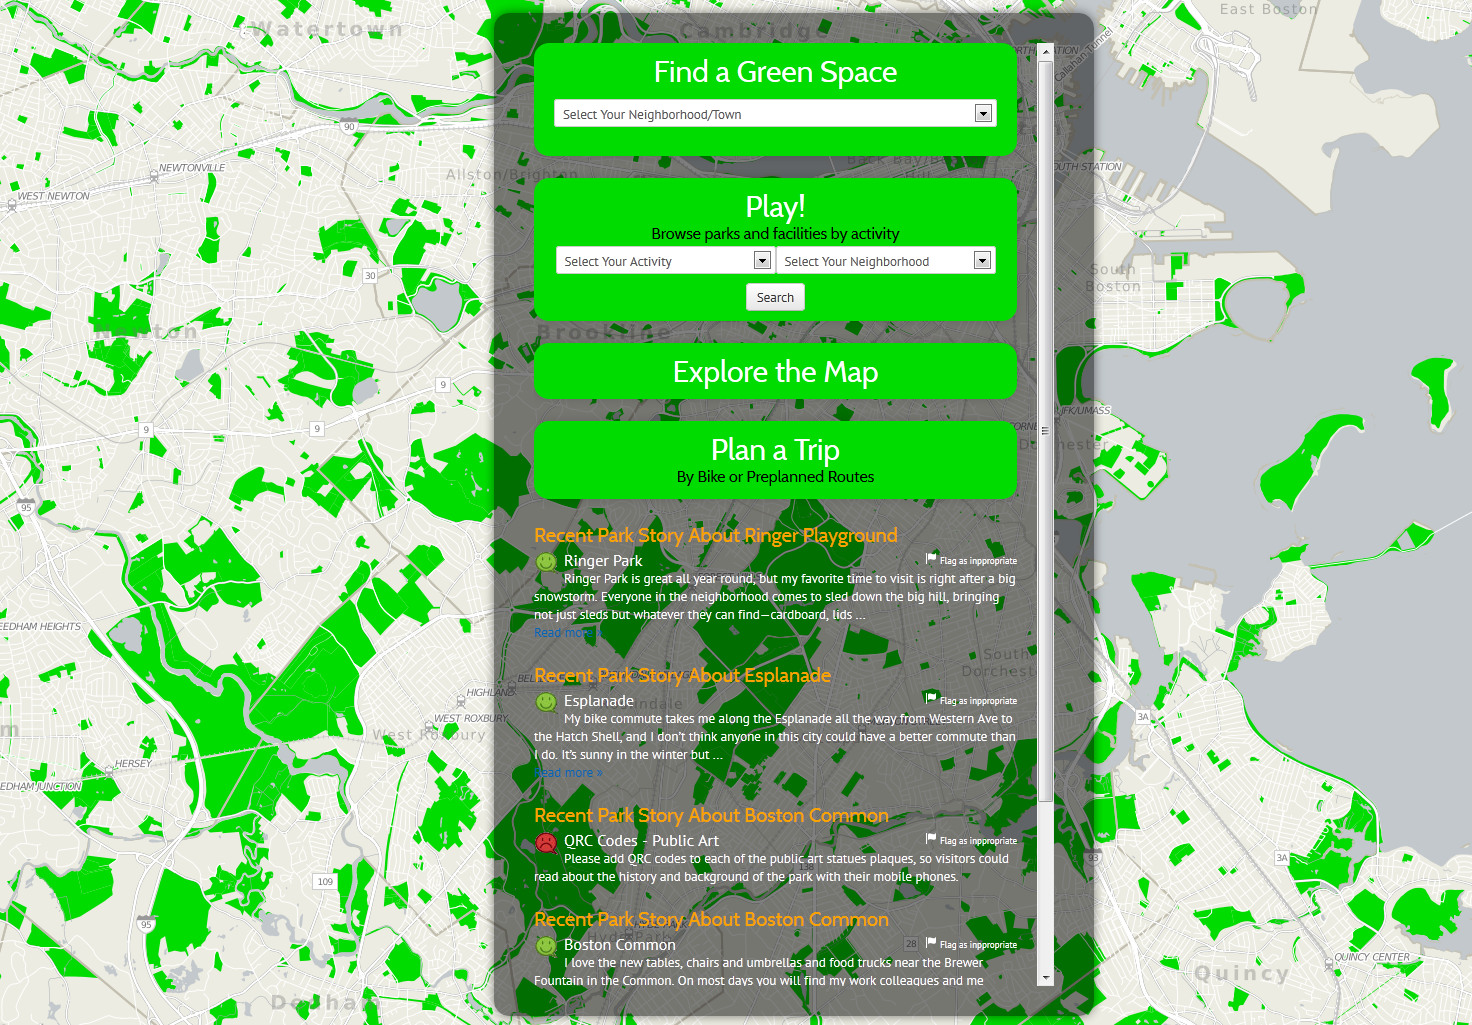
In collaboration with Boston Parks Advocates, MAPC developed an interactive website for Boston area parks (website no longer maintained as of July 2016). Users can search for parks by activity and neighborhood, plan trips, and find biking and walking routes. After they have visited a park, users can share their experiences in the Park Stories section and report any problems with the park to the responsible department. So far, the site covers Boston, Cambridge, Somerville, Belmont, Brookline, Arlington, and Chelsea.
CI:Now was awarded a one-year $50,000 operating grant from the Kronkosky Charitable Foundation to support child data integration and community engagement around child data and information. Kronkosky was a founding member of CI:Now when it was organized as the Alamo Area Community Information System (AACIS) in the late 1990s, and the Foundation continues to recognize the power of shared data for improving community conditions.
Center on Poverty and Community Development (Cleveland)
March 6, 2012
The Poverty Center's Neighborhood Stabilization Team Web Application (NST Web App) was selected as a Leadership in Community Innovation Award finalist. Four finalist groups competed for the award which included $25,000, funded by Key Bank, to go toward continuing projects. While the Center did not win the final award, it was an honor for the NST Web App to be recognized and selected as a finalist.
The Open Indicators Consortium (OIC), which operated from 2008 to 2014, was founded by partners from across the United States who came together to support and guide the development of the Weavesoftware and its application as a high-performance open source data analysis and visualization platform free to all.
University Center for Social and Urban Research (Pittsburgh)
February 24, 2013 to February 25, 2013
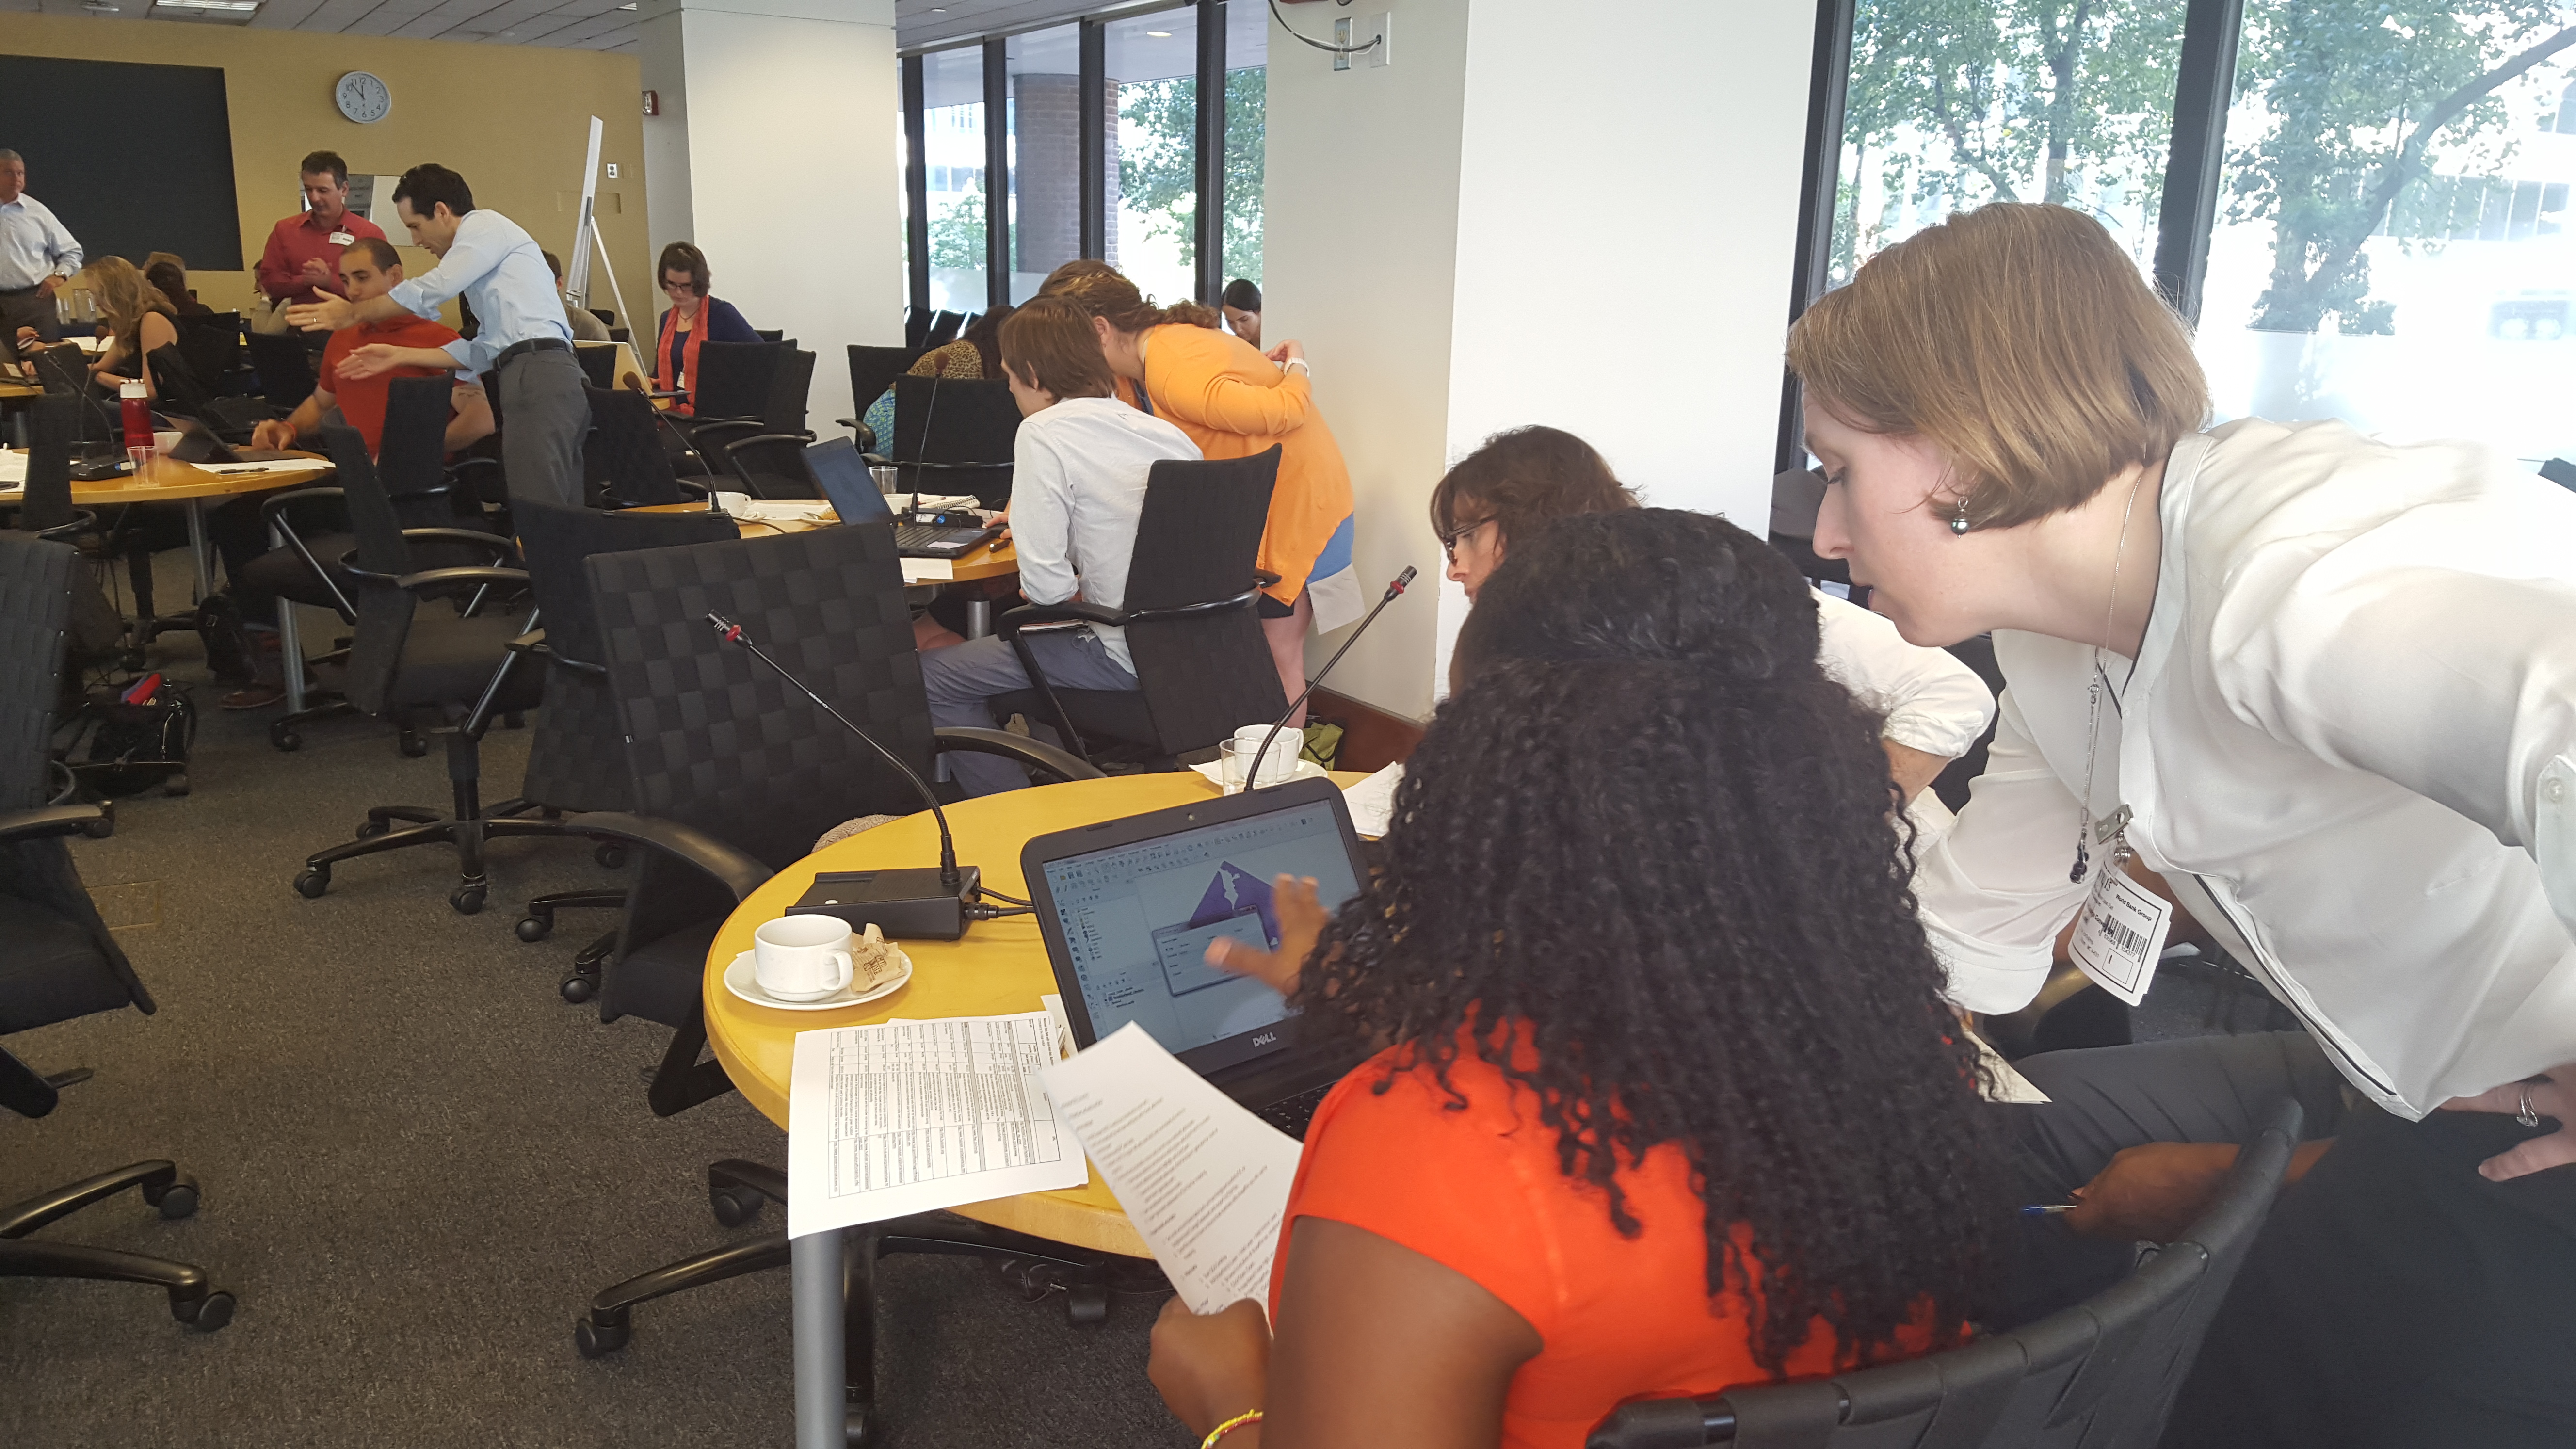
UCSUR’s Pittsburgh Neighborhood and Community Information System (PNCIS) is helping to organize the first ever Steel City Codefest on February 24 and 25. Codefest will challenge software developers to turn public information into an application that benefits area residents, visitors, and businesses. Codefest participants will be given access to city, county, state, and federal datasets and will have one day to create their software applications.
Rise has launched its new website, www.datagateway.org, completing a major phase in the transition to a dynamic electronic resource for the many organizations that rely on Rise in their work to improve the lives of St. Louis residents. As Rise enhances its interactive potential with new tools for data visualization, it has also strengthened its interpretive capacity. New partnerships are helping in this effort, adding valuable perspectives and expertise.
Visualizing Neighborhoods is a day-long event to bring together neighborhood leaders, technologists, data visualizers, designers, artists, scientists, civil servants, and anyone else interested in exploring how data can be used for research, analysis, mapping, outreach, engagement, and communication in our neighborhoods. The goals are to start conversations, build community, experiment, and prototype projects for neighborhoods.
Our continual effort to share information expeditiously has found another portal. We are pleased to launch the Data Sharing Hub. The website uses the CKAN 2.0 and is designed to accommodate an array of file types allowing CMAP staff to post data for discovery by anyone with access to the internet. No passwords or usernames are required to view or download the data. Users are a point and a click away from much desired data.
PlanningCamp is an unconference in Oakland sponsored by the Urban Strategies Council and OpenPlans for those working at the intersection of technology and the hard effort of making better cities -- on the technology side, or the planning side, or a bit of both.
Dorothy A. Johnson Center for Philanthropy (Grand Rapids)
2014 - 2015
The Community Research Institute has released the first phase of Community Profiles 2.0 for the Grand Rapids area. This phase aims to build upon CRI's existing work in housing and economics within the City of Grand Rapids.
University Center for Social and Urban Research (Pittsburgh)
February 22, 2014 to February 23, 2014
The Steel City Codefest is a city-wide app building event that brings together coders, designers, and innovation enthusiasts to create apps for local government, citizens, and community organizations over a 24-hour period. Participants form teams, tackle challenges and compete for prizes. Codefest 2.0 will allow teams to use their creativity to develop and build innovative apps.
(Inactive) Nonprofit Center of Milwaukee (Milwaukee)
May 31, 2014 to June 1, 2014
Image:
The Milwaukee Data Initiativein coalition with local developers, the City of Milwaukee, the County of Milwaukee and BucketWorks to tackle local data projects as part of the National Day of Civic Hacking. Participants included open data supporters, designers, programmers and data analysts from around the state, who created open data applications, data scrapers, maps and data sets.
(Inactive) Network Center for Community Change (Louisville)
May 31, 2014
Image:
Hack for Change Louisville was organized to conencide with the National Day of Civic Hacking. This day-long event focused on building five projects: WFPL Radio's Curious City project, a pet adoption search based on information from the City's open data portal, a recreation of Louisville with Minecraft, and two projects for NNIP Partner Network Center for Community Change: a neighborhood explorer built through Open Street Map, and Shareabouts, a way for locals to share positive locations and memories in their neighborhoods.
In 2014, D3’s Prototype project, ConCensus, had two overarching goals: (1) to deepen our methods of community engagement and (2) learn about the needs and challenges around tools for collecting and accessing place-based primary data. D3 initiated a six-month outreach to organizations to examine how communities currently access data and to identify the types of data that would better support their mission-driven work.
From 2014 to 2018, the Civic Tech and Data Collaborative (CTDC) brought together local government officials, civic technologists, and community data organizations across seven communities to explore how to harness data and technology to benefit low-income residents. Three national organizations with local networks - Living Cities, Code for America, and the National Neighborhood Indicators Partnership – guided the initiative Local collaboratives in Boston, St. Louis, and Washington, DC created products that use data and technology in new ways to improve services or programs in their cities.
University Center for Social and Urban Research (Pittsburgh)
October 15, 2015
University of Pittsburgh Senior Vice Chancellor for Engagement and Chief of Staff Kathy Humphrey, Allegheny County Executive Rich Fitzgerald and City of Pittsburgh Mayor William Peduto announced the launch of the Western Pennsylvania Regional Data Center.
This session was conducted by NeighborhoodInfo DC for a group of local area nonprofits who are partipating in the Measure4Change learning community. The purpose of the session was to show groups how accessing data outside of their organization could be valuable to help them assess the needs of the populations and communities they are serving and to report on their results.
Camille Seaberry from DataHaven will demonstrate how to work with the ACS R package to use the Census API to download and run ACS data. Join the webinar to see the demo, ask questions, and share your thoughts on ways to be more efficient in updating the ACS!
(Inactive) Institute of Portland Metropolitan Studies (Portland)
April 2018
Image:
We have launched the Northwest Open Data Exchange (NODE), a platform that pulls together the immense quantities of open data generated by PSU faculty, staff, and student research. Built on the open-source CKAN framework, our platform offers easy search and analysis tools, fast harvesting of outside datasets, and an API data engine that can link to Geoserver, R, and Leaflet.
The Houston Community Data Connections (HCDC) compiles and organizes neighborhood level data from various sources to facilitate the use of data and inform decision-making. Besides providing technical assistance and research services to a variety of organizations such as nonprofits, government agencies, media and advocacy groups, we also engage with community and local stakeholders to understand the changes in and challenges to our neighborhoods, and ultimately to address equity issues.
Through an NSF-funded grant from the South Big Data Hub, the Baltimore Neighborhood Indicators Alliance at the University of Baltimore is partnering on a project with Towson University to create a series of webinars open to the public to learn about and evaluate several open data portal technologies for publishing data for smart cities and data science for social good.