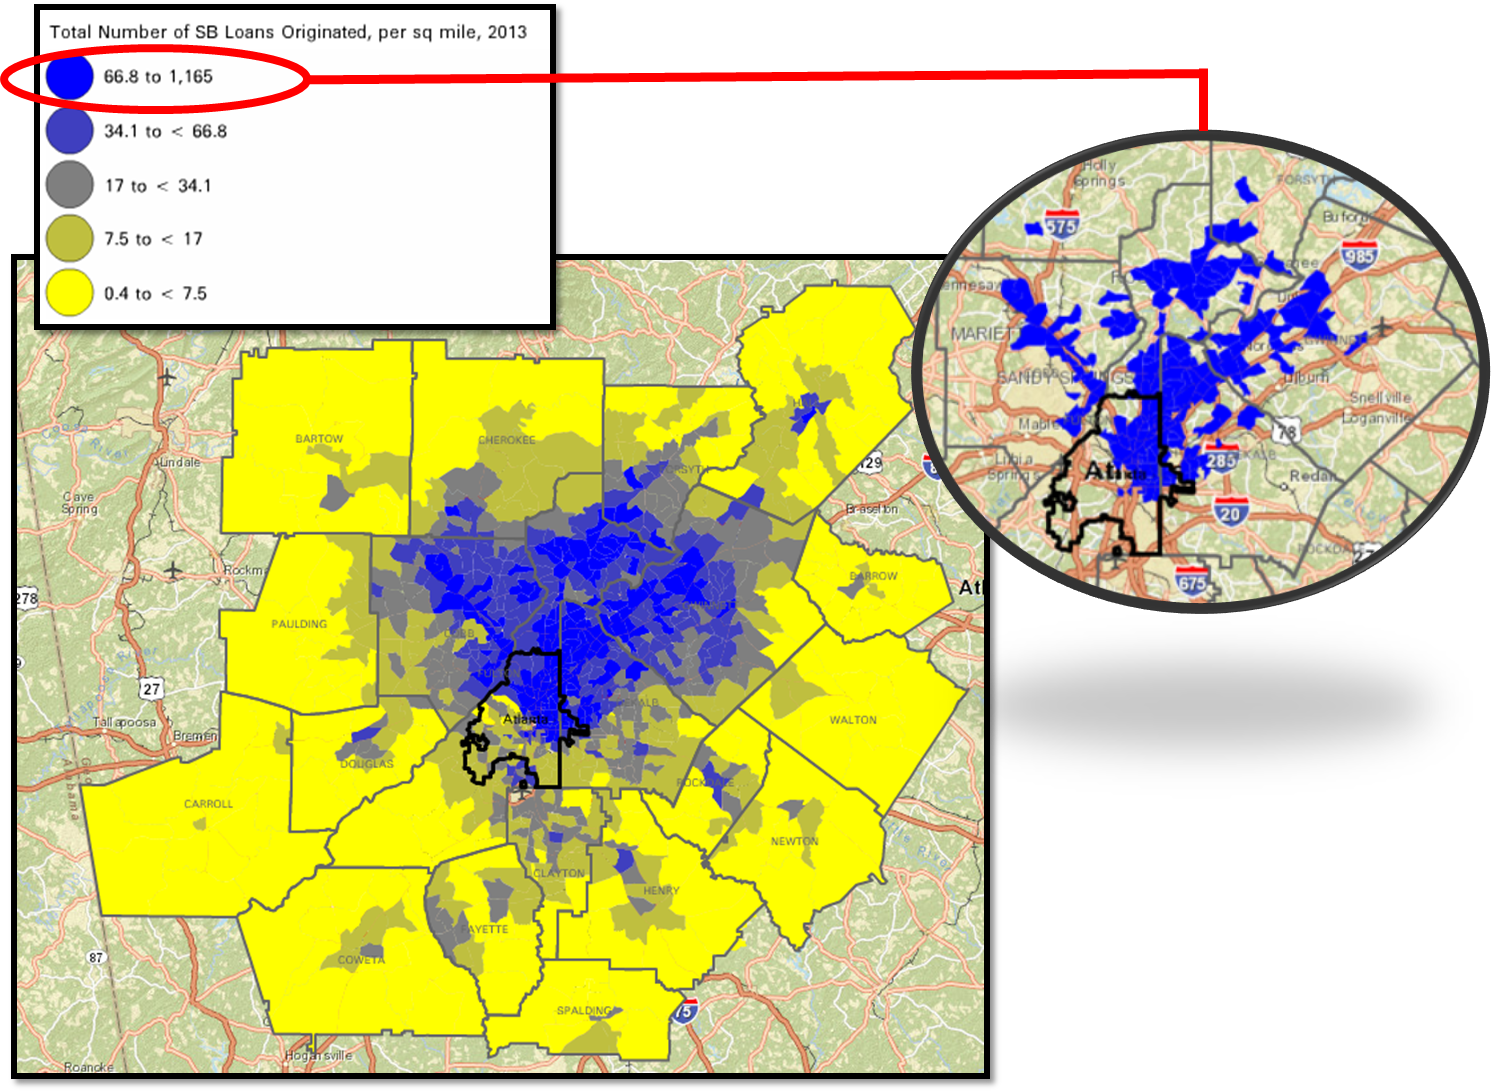
Where Banks are Investing in Metro Atlanta
Small Business Loans per Square Mile, 2013
(Blues are highest)
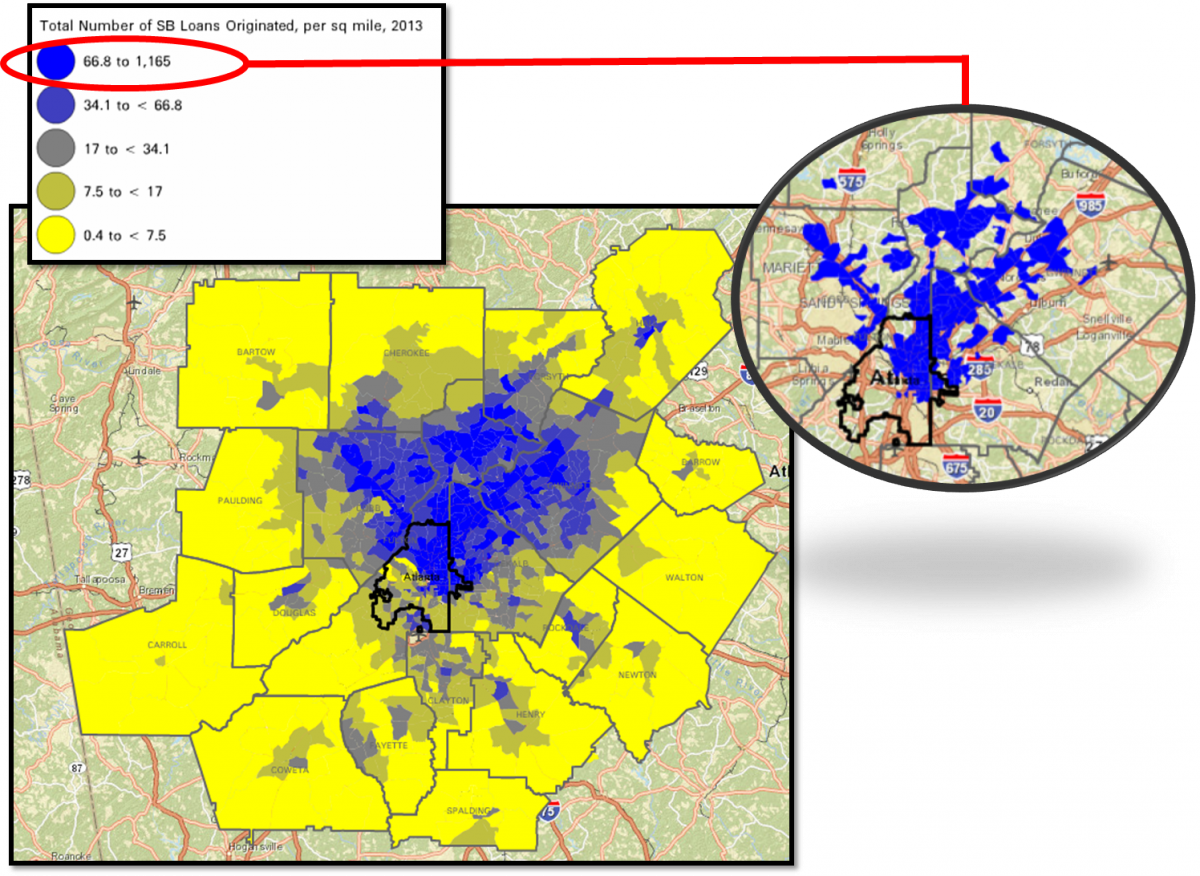
Neighborhood Nexus recently put up some interesting new data - the distribution of small business loans. The map, as you can see, shows the uneven distribution of commercial lending to small businesses. But this is actually a familiar story.
Before we tell you why this familiar, first a little background information on the data. They come from the Community Reinvestment Act (CRA), which requires banks and other lending institutions of a certain size to report where their loans are going. The loans reported are for less than $1 million. The idea was to assess how well local lending institutions are meeting the needs of the communities they serve. Here is a good primer on the CRA, along with some important caveats.
Here are some quick highlights from the blog post:
We isolated the top 20 percent of neighborhoods (census tracts) for small business lending activity. (These are the areas highlighted in dark blue in the inset of the above map.) These areas total about 4.6 percent of the region’s land area, but represent:
- 36 percent of the region’s small business loans
- 42 percent of the region’s jobs
- 17 percent of the region’s population
PNG